- Published on
ML Ops
- Authors

- Name
- Ashish Thanki
- @ashish__thanki
Introduction
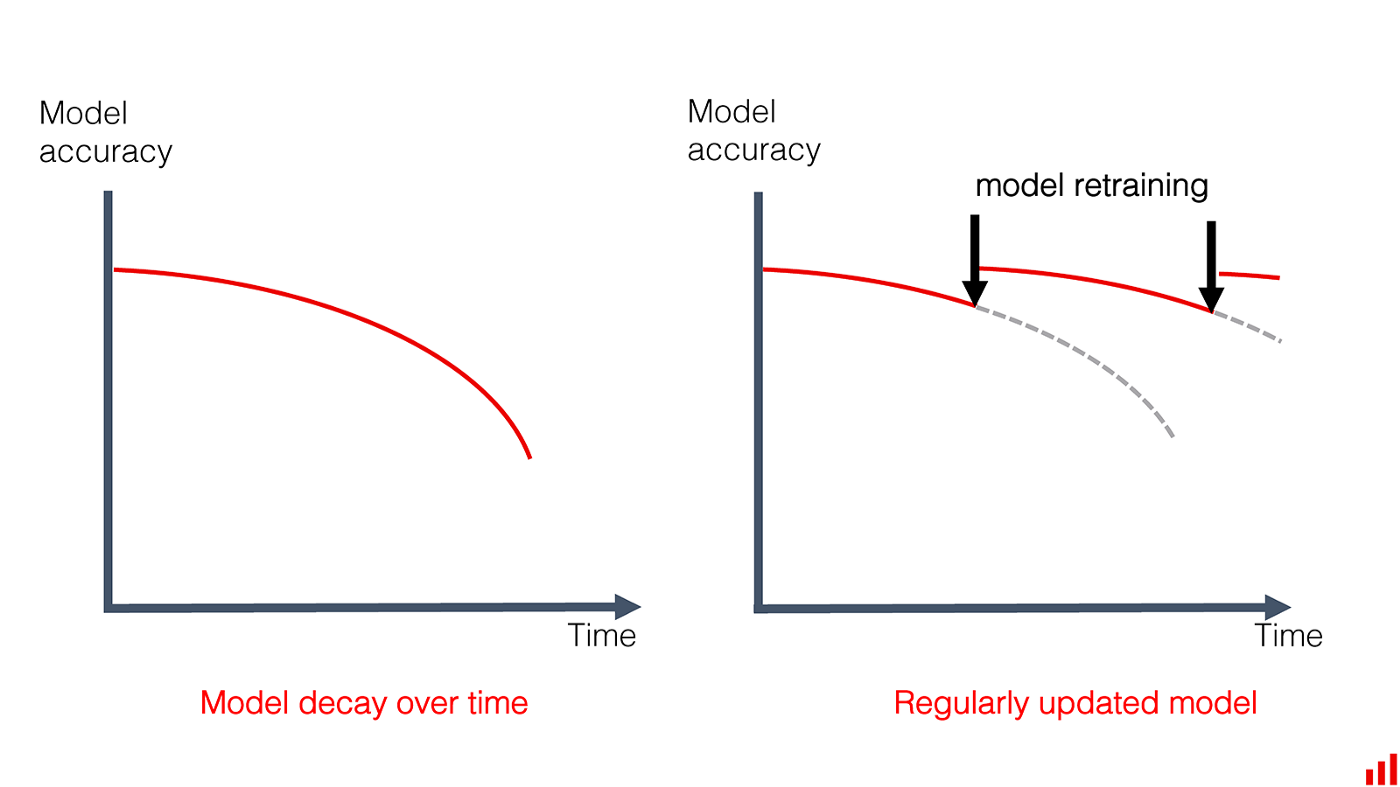
Traditional software application code is deterministic and always runs as written. When you deploy new code, hopefully, all the rigorous tests you've written, work and catch any bugs allowing the application to continue to work as expected. However, the world of machine learning is different. Machine learning models are dynamic and, thus, they degrade overtime after being deployed to production. They are sensitive to real changes to the world. A model is at it's best just before being deployed.
There are two levels for monitoring a machine learning model in production: Functional Level monitoring and Operational Level monitoring.
Functional monitoring involves monitoring the model performance, input, and output. Operational monitoring involves monitoring at the system and resource levels.

Functional monitoring
This is typically the responsibility of the data scientist where we must monitor the input data, the prediction made by the model, and what goes inside the model while making that prediction during production (see my Model Interpreting blog).
There are many possible problems that can cause poor model predictions along the data pipeline. Although many of these processes requires input from the data scientist. We must ensure other teams are alerted so a holistic, longer term solution, can be deployed rather than a code patch from the data scientist.
Input Data
Monitoring the input data ensures the model gets what the data scientist expected when the model was first trained. Any deviation from this will cause poor predictions (GIGO - garbage in garbage out) - which is why we need to ensure we monitor the data before it even passes into model.
There are three cases you may want to monitor the input data:
1. Data Quality issues:
Monitoring data properties we can ensure that a flag, or an alert, is triggered when the data is not what we expect so that the data team or service owner can take a look.
These can also be caused by preprocessing steps within the data pipeline, changes in source data (e.g. data schema change, column renaming), or data loss/corruption.
To name a few examples, we can write numerous tests to detect data quality issues:
- Duplicates;
- Missing values;
- Syntax errors;
- Data type or format errors;
- Schema changes;
- Data profiling;
This list can go on and on for tabular datasets but also extends out to include visual, audio and video based data types.
2. Data Drift:
Monitoring data drift is an important part of functional monitoring. We can understand ahead of time when the data is changing and retrain the model to the change in distribution between the training data and production data. This process typically happens over time.
These changes are particularly common in features, thus, we must pay close attention to changes in individual features too.
Descriptive statistics can be used: measure of central tendency, measure of variability, measure of frequency and measure of position - read more at my blog post here and this towardsdatascience blog here. We would need to understand the domain and use relevant metrics to ensure the features do not degrade model performance. For example, these properties could include standard deviation, mean, mode, median and so on.
To detect data drift we can introduce distribution tests into pipeline such as divergence, distance, or, categorical tests. The output of these tests can then form the foundation of measuring these changes, alert the service owner, start a retraining cycle, alert the data scientist to build a new model, or build a challenger model and then perform A/B testing against the deployed one.
3. Outliers:
Outliers do not have a learnable structure across an entire dataset so will cause the model to return unreliable responses. It is one of the hardest data issues to detect, because extreme values can be a one off event and difficult to handle through rules.
We can attempt to detect outliers by performing tests similiar to that of the data drift ones, create a supervised learning, or use autoML to detect outliers.
The solutions may involve data slicing and analysing model performance on each subset of the data (i.e. cross validation folds), understand when the outlier occurs (by performing analysis) and introduce rules or human intervention to assist with the decision process for that period.
Model
The input data is arguably one that could change the most. However, the model is the most important piece to monitor.
1. Monitoring Model drift
Similar to data drift, model drift occurs when the relationship between the features and the target no longer holds due to changes over time. The model predictions become increasingly unreliable and less accurate over time, and no longer meet the benchmark, business metrics and KPIs set out.

There are several types of model drift:
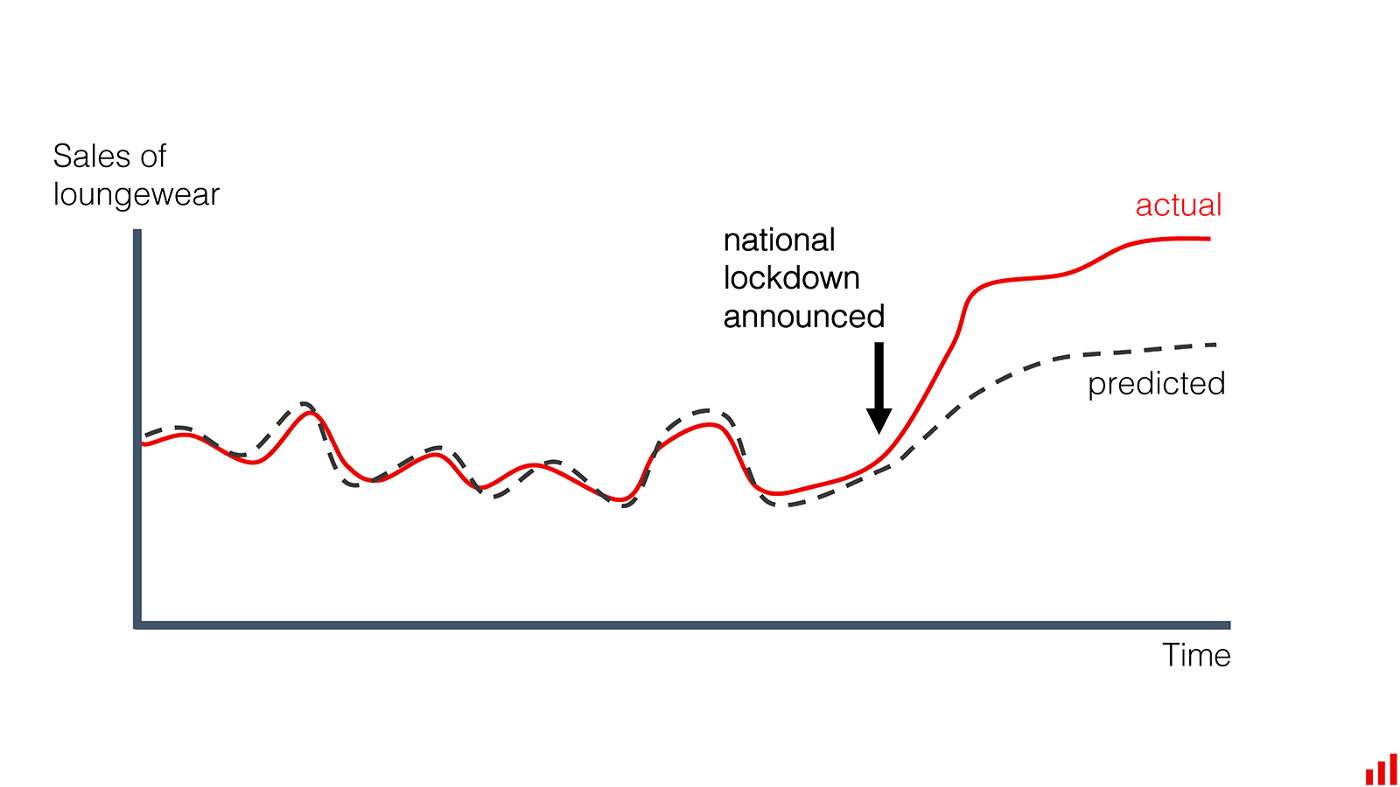
- Instantaneous model drift, a sudden drop in model performance caused by input data issues. An example of this is when COVID-19 lockdowns started, input data changed rapidly while predictions made by the model could not keep up.
- Gradual model drift occurs when data changes over time as a result of external factors such as user behaviour changes, new features, or new demographics.
- Recurring model drift is caused by seasonal events that occur periodically. For example, holidays, yearly discounts or customer spikes in regions.
- Temporary model drift occurs during strange, one-off events. For example, the model temporarily drops in performance because of a spike in newer clients, system performance issues, or adversarial attacks before returning back to normal levels.
To monitor model drift we can set the predictive metrics threshold and either perform hyperparameter optimisation, retrain the model, send an alert when we need to analyze the model for degradations or drifts, or, more challengingly, use online learning algorithms.
2. Model Configuration and Artifacts
Just like any other report or business document, we need to keep track of all configurations related to our model. This can aid in replication and help use replicate our work for others. The configuration file contains model information, version, author, hyperparameters, dependencies, features values and more. This can help us understand when things started going wrong and why.
Tying the configuration with the deployed model version is a great way of ensuring the right model is deployed.
3. Concerted adversaries
Machine learning models are susceptible to adversarial attacks. They vigorously attack your system/model so it makes a mistake. To monitor these sort of attacks we need to flag inputs with outlier events, it is common for adversarial attacks to be atypical events. Another possibility is adding human intervention to the pipeline whenever a marginally detected anomalous event occurs within the input data. We could also add business logic to the pipeline and modelling so that subject expert knowledge on adversarial attacks can be incorporated.
Predictions
Monitoring the predictions that the model outputs can provide many useful insights and allow us to compare it to business KPIs.
1. Model evaluation metrics
Different machine learning problems require the use of different metrics such as regression, classification, clustering, reinforcement learning, computer vision and so on. We should monitor metrics most relevant to the machine learning problem that we are trying to solve and the business KPIs.
As you probably already know, metrics for a classification model include:
- Accuracy
- Confusion Matrix,
- ROC-AUC Score,
- Precision and Recall Scores,
- F1-Score.
Metrics for a regression model include:
- Root Mean Square Error (RMSE),
- R-Squared, Adjusted R-Squared and Normalized R-Squared Metrics,
- Mean Absolute Error (MAE),
- Mean Absolute Percentage Error (MAPE).
2. Truth Labels
It is sometimes unclear whether true labels will be present when predictions have been made, or, real time model metrics are even possible at all and a delayed metric is reported instead. Comparing actual labels to predictions in production is a very difficult task in most cases.
When true labels are not available we can catch monitor the prediction distribution as this should have been set to the business KPI.
Operational level monitoring
The system monitoring and operation typically falls under the responsibility of the IT operations team but this has to be a shared responsibility when it comes to machine learning and deployment of models. Data scientist should be responsible for monitoring model performance and data coming into the model.
System performance monitoring
This is primarily an infrastructure problem. We need to make sure that the application's latency, uptime, scalability, adaptability, extensibility etc are monitored and metrics are being tracked. Understanding these key metrics can help data scientists if their model has high latency in returning predictions, which may have affected the overall application's speed.
The metrics that may be worth monitoring include, but not limited to: CPU/GPU utilization, memory utilization, failed requests, API calls, and response time. This may not be the direct responsibility but it's extremely helpful to be aware of the system that is powering your model.

Pipelines
This can be tricky for the DevOps/IT team to monitor unless the data scientists communicate what the model expects while the team can tell us what the pipeline should output.
We can monitor the input data's schema and completeness, while implementing validation checks on the data with the right alerts being sent whenever the data starts to drift.
The intermediate workflow steps, also called DAGs or CRON jobs, should be monitored too. Metrics such as run time, file types, file sizes, state of job, data distribution, number of features etc. should closely align or exactly match what we expect.
Finally, the output data schema schema and completeness should also be monitored so it does not cause failures further down the pipeline.
Conclusion
A lot of what has been written in this blog may seem obvious but you would be surprised on how almost none of this is being practiced. Thus, I start this conclusion by recommending that you encourage your team to incorporate a monitoring strategy and properly document their decision process. Centralize your monitoring so it is under one platform, ideally one that has many of the basic metrics out-of-the-shelf. Meanwhile, decentralize the monitoring power so that data professionals and Ops engineers communicate frequently between one another creates a decentralized knowledge structure.
Monitoring is about collecting the dots, observability is about connecting them! Once we observe any type of drift we should alert the right people and log this information. Monitoring is never the final step and should be thought about from the very start.
Overall, with proper monitoring we can ensure that model performance is optimal throughout it's deployment and never drifts when subject to many production level issues.
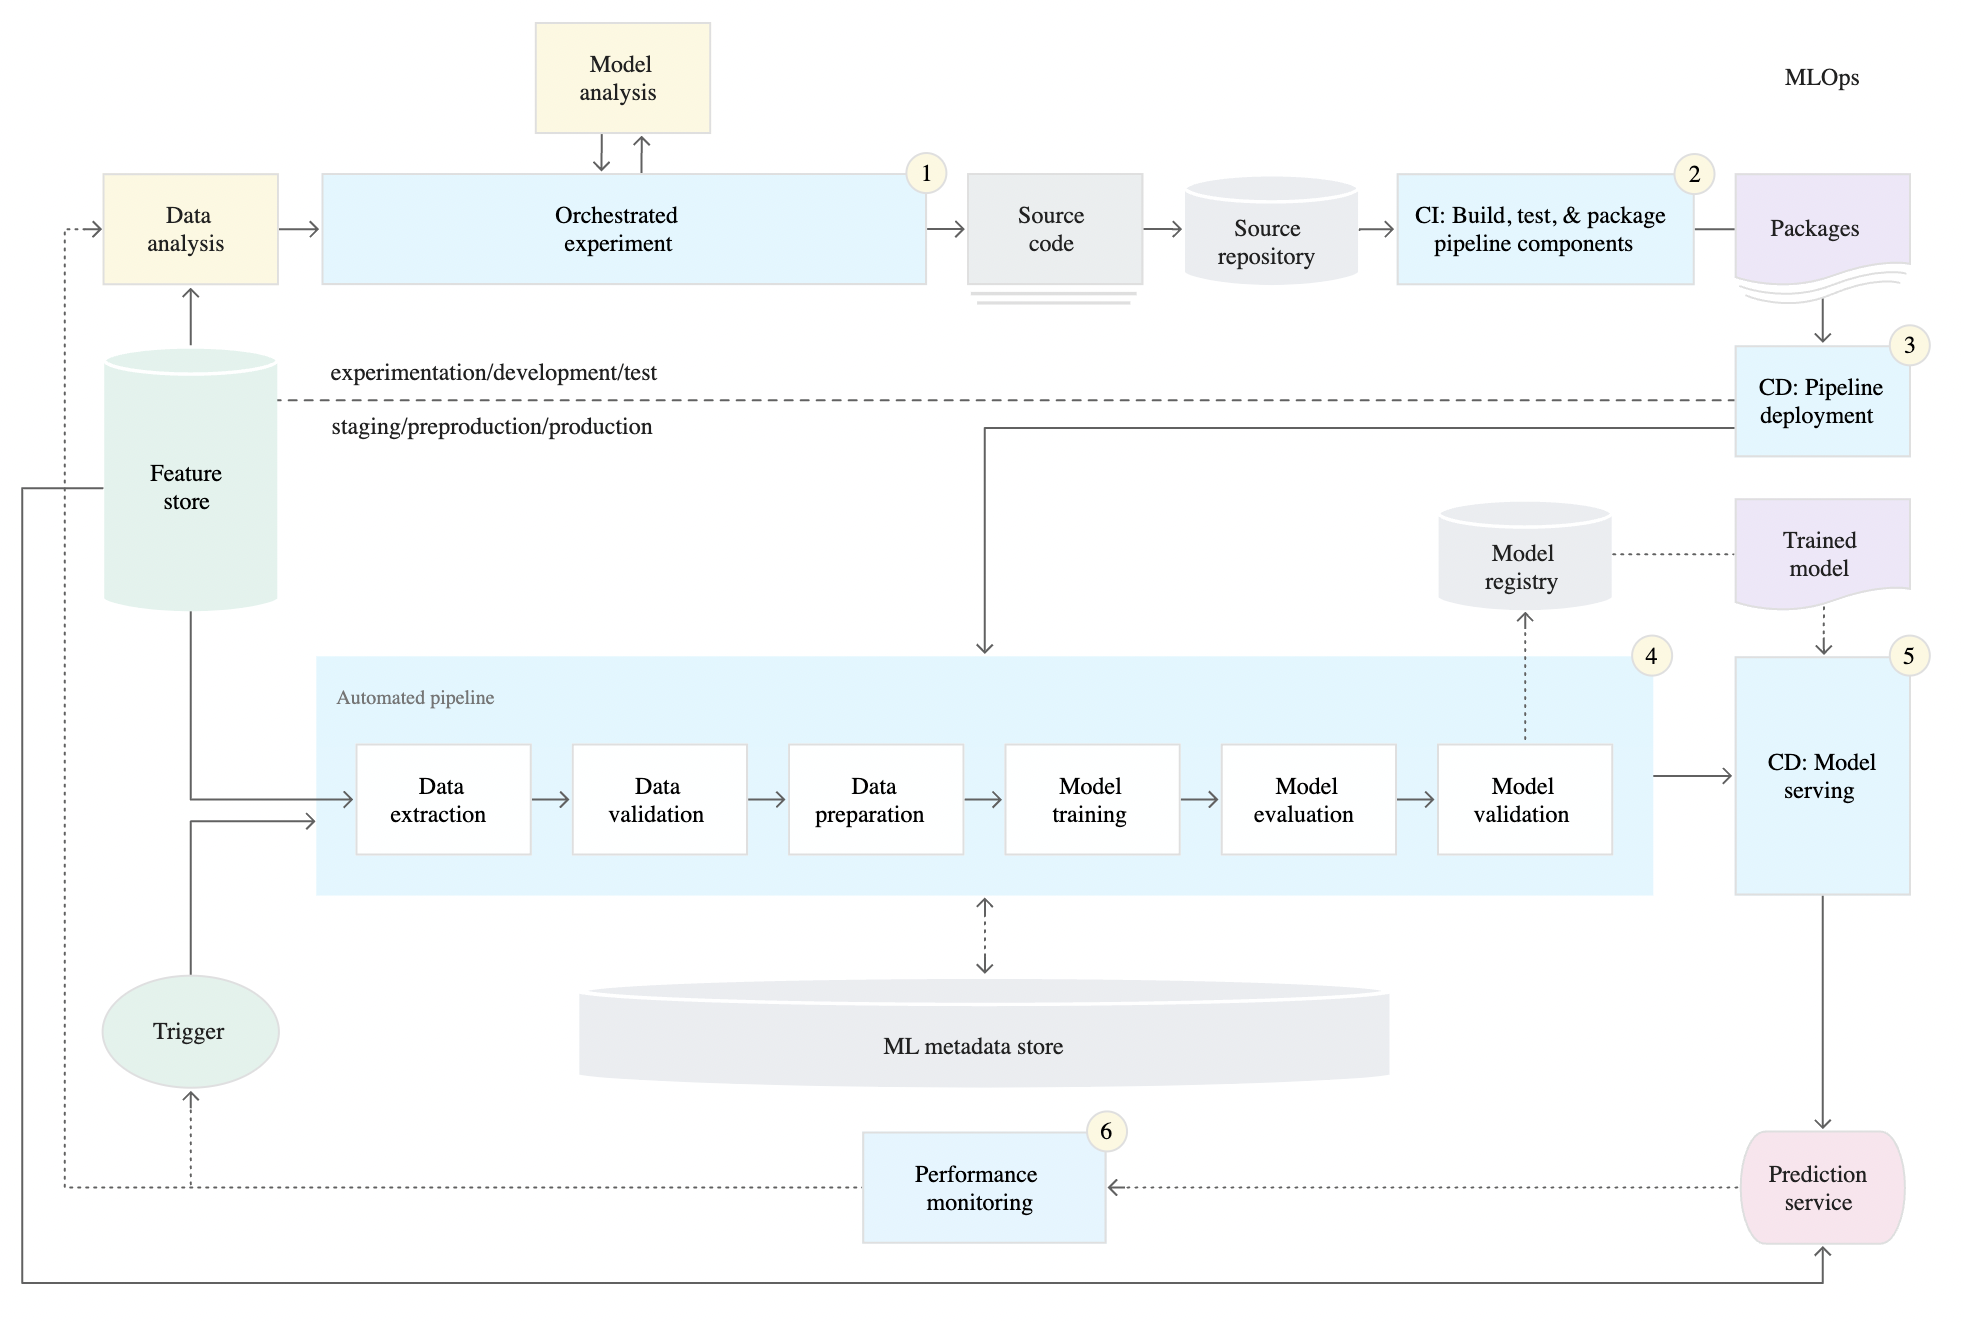
To learn more, I would recommend reading Google Cloud's documentation on CI/CD for ML systems here. The three levels of MLOps can clarify what needs to be developed in your ML pipeline and what you can do to build it, below is an image of level 2 - a robust and automated CI/CD system.

Further Reading: